I had no idea what the server was doing
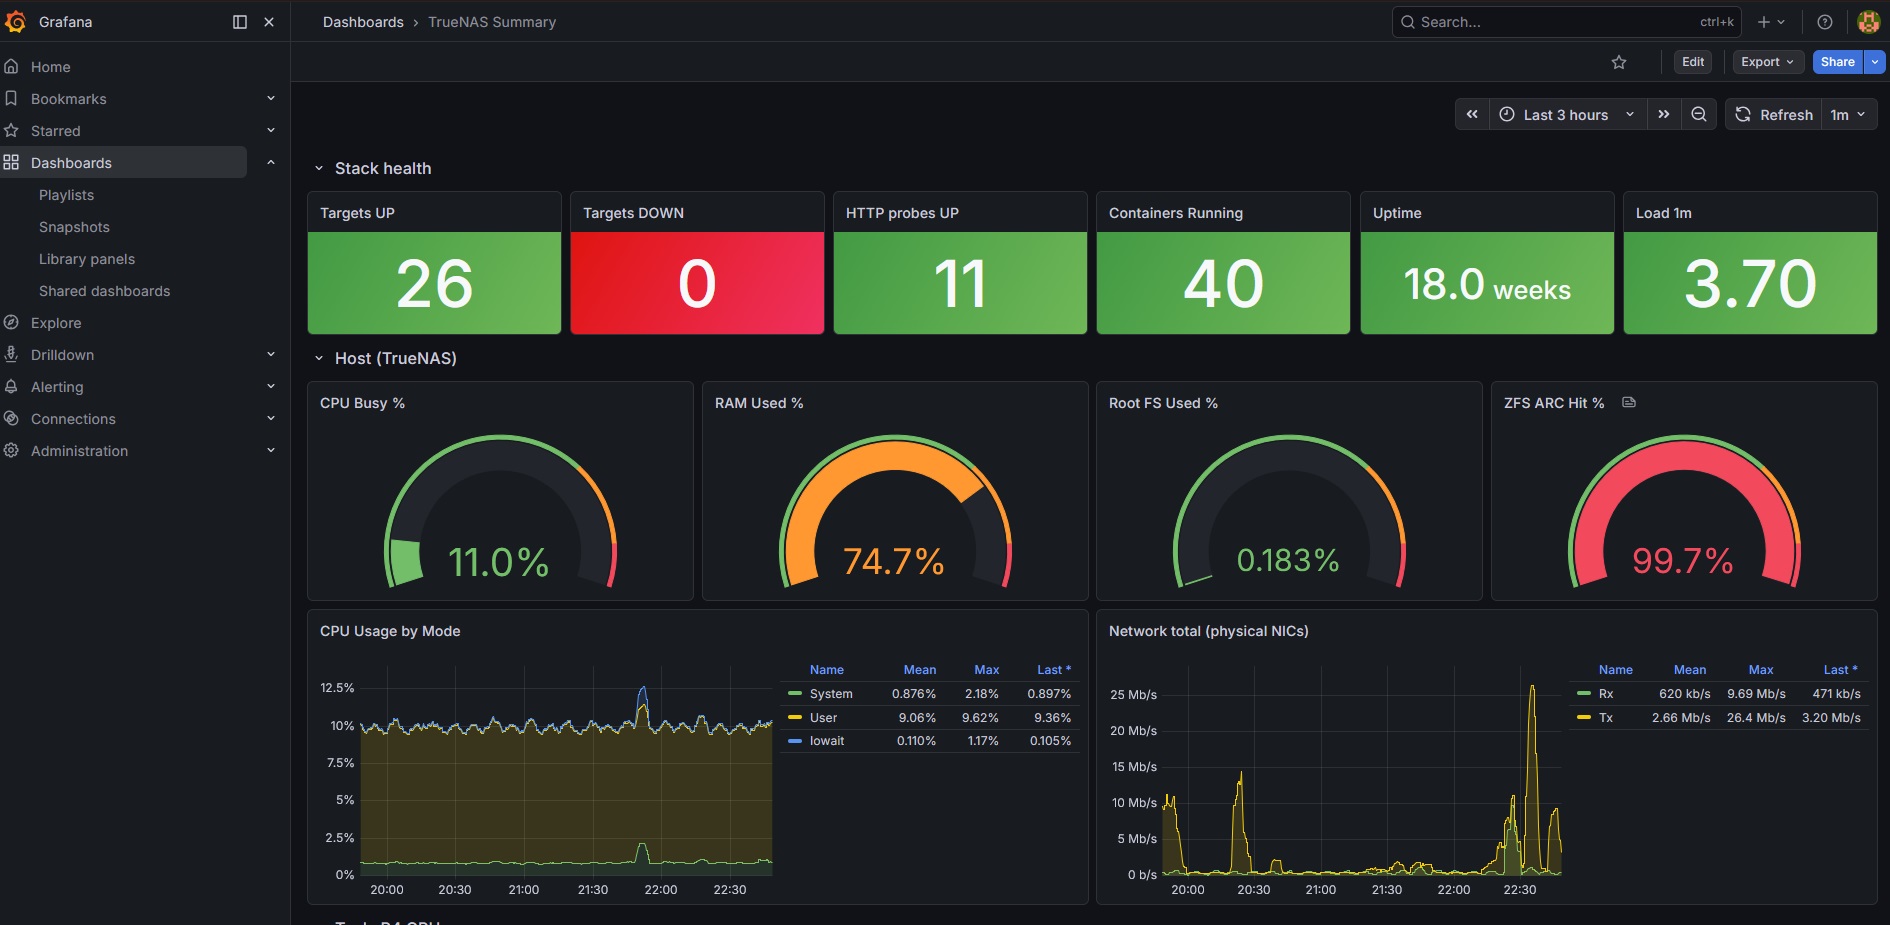
I was running a dozen services and finding out something was wrong by trying to use it. So I built out Grafana and Prometheus properly — 13 dashboards now, fed by nine exporters and a set of uptime probes.
It started as a bug hunt. I'd installed a community dashboard and it rendered completely empty. The cause turned out to be a dropdown inside the dashboard that picks which data source to use, which was never actually bound to mine. Everything was collecting fine, the dashboard just wasn't asking anything.
Nine exporters and a pile of probes
- Host — CPU, memory, disk, network, and about 2,300 ZFS metrics including ARC hit ratio.
- Containers — per-container CPU, memory, and network.
- GPU — the Tesla P4's utilisation, split out by compute vs encode vs decode, plus VRAM, temperature, power and clocks.
- Logs — Loki and Promtail collect every container's logs plus the reverse proxy access logs, so I can search them instead of SSHing in and tailing files.
- Uptime — 12 HTTP checks and 4 ping checks, so a service being down shows up as red instead of me discovering it later.
- Syncthing — a small Python exporter I wrote myself, because Syncthing's built-in metrics endpoint only reports Go runtime stats and nothing about actual sync state.
They're organized into folders — Host & Storage, Apps, Network & Edge, Logs — with one summary dashboard on top that links into the others.
Build the dashboards yourself
The popular community dashboards are written for older Grafana versions and some of their panels just don't render on Grafana 12. I tried patching the broken ones for a while before giving up and deleting them.
Hand-built dashboards with a plain, minimal panel config render fine and I understand what every panel is asking for. They took an afternoon and they've never mysteriously broken.