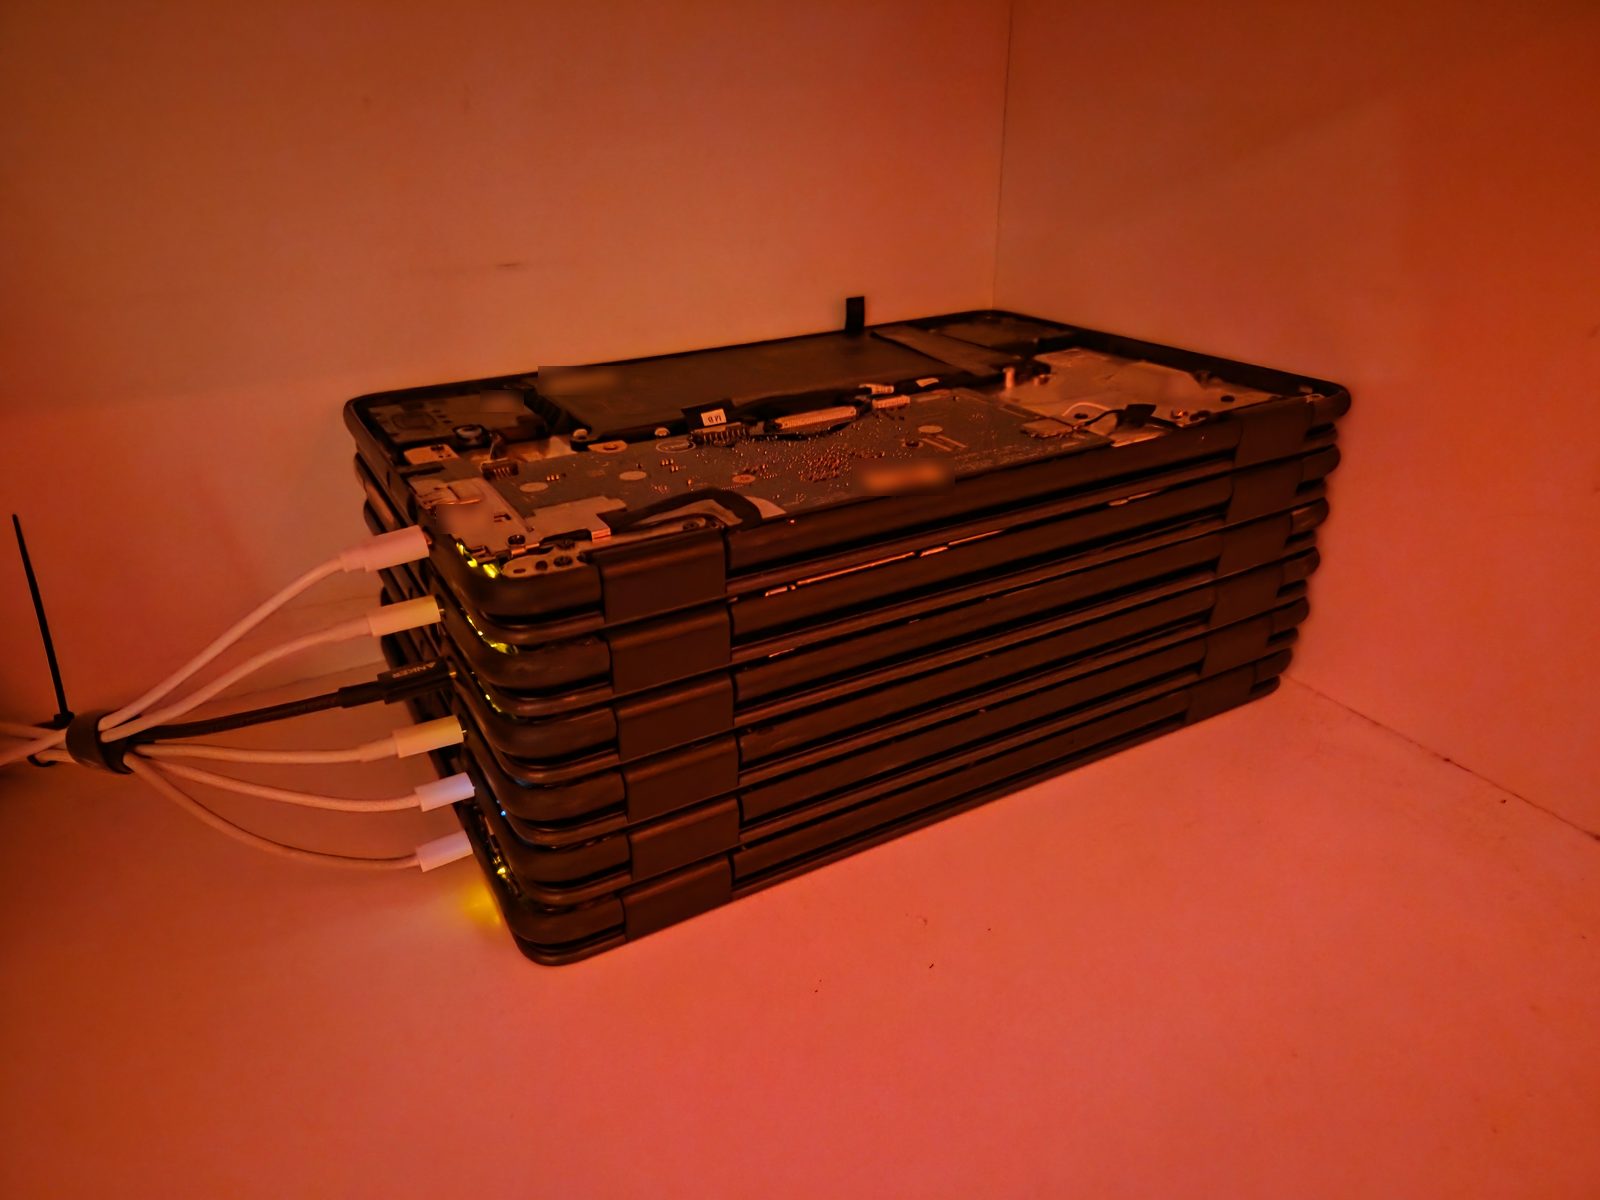
Six Chromebooks pretending to be a server rack
I had a pile of old Dell Chromebook 3100s doing nothing, so I wiped them, put Debian on them and turned them into a Kubernetes cluster. They're stacked screen-down on a shelf with all six chargers zip-tied into one bundle. And yes, the whole thing runs over Wi-Fi. That's the joke, and it's also the main engineering problem.
| NODES | 6× Dell Chromebook 3100 |
| CPU | Celeron N4000 / N4020, 2 cores each (12 total) |
| RAM | 4GB each (about 22GB usable total) |
| STORAGE | 16GB eMMC each |
| NETWORK | Wi-Fi only (for now) |
| OS | Debian 13 (trixie) |
| CLUSTER | k3s 1.35, control plane on my TrueNAS server |
Is it practical? Not really. Twelve slow cores and 22GB of RAM is less than one decent desktop. But the laptops cost me nothing, the stuff I moved onto them is genuinely better off the NAS, and it's fun.
The NAS is the brain, the Chromebooks do the work
The k3s server runs in a Docker container on my TrueNAS box, because that machine never turns off and has real storage. The six Chromebooks join it as worker nodes. I tainted the NAS node so nothing lands on it by accident, which means everything has to run on the Chromebooks. Even the cluster's own DNS and metrics pods moved over.
Joining a new node is one script: it installs curl, tells the laptop to ignore the lid switch so it doesn't go to sleep when it's stacked, and installs k3s pinned to the same version as the server. That's how node 6 joined.
Wi-Fi power saving was the whole lag problem
The first thing I noticed was terrible ping between the nodes: around 70ms on average with spikes past 200ms, for laptops on my own home network. It turned out the Intel Wi-Fi driver had power saving on, on every single node.
I put a tiny DaemonSet on the cluster that turns power saving off on every node and re-checks every five minutes, so a new node gets fixed the moment it joins. Ping dropped to about 2ms.
iw dev <interface> get power_save first. That one setting was the difference between unusable and basically fine.Small, boring, useful stuff
- An outside watchdog. All my monitoring lives on the NAS, so if the NAS dies, nothing tells me. The watchdog runs on the Chromebooks instead and checks the NAS, the monitoring stack, the web server, the internet and my public sites from outside, then alerts me if something stays down. If the router goes down it waits and sends one summary afterwards, instead of ten alerts for one problem.
- The AI roundtable bots. They only talk to APIs, so they don't care what hardware they run on.
- Prometheus exporters for Cloudflare, Syncthing and Lidarr, moved off the NAS.
- A tiny container registry, so I can build images on the NAS and pull them onto the nodes.
- node-exporter and kube-state-metrics, which feed the Grafana dashboard.
Anything that needs real storage or a GPU (Jellyfin, Immich, the music pipeline) stays on the NAS. With 4GB of RAM and 16GB of eMMC per node, I'm not pretending these are servers.
A Grafana dashboard for a stack of laptops
The cluster has its own Grafana dashboard: nodes ready, CPU and RAM per node, CPU temperature, battery charge, free eMMC space, Wi-Fi signal and traffic, which pod is running where, and a timeline of every watchdog check. The battery graph turns out to be really useful. One node's charger has already given me trouble, and a slowly falling line will warn me about the next one long before the node dies.
Right now it shows 6 nodes ready and 22 pods, with about 3% CPU and 3.5GB of RAM in use across the whole cluster. The CPUs sit between 42 and 58°C with no fan, stacked right on top of each other. They do basically nothing most of the time, which is exactly what I want from them.
What's left
- USB Ethernet adapters, so Wi-Fi is only the backup.
- Better chargers for the nodes that can't keep up.
- An alert for when a node drops out or starts running on battery.